
Sales Unit billion KRW
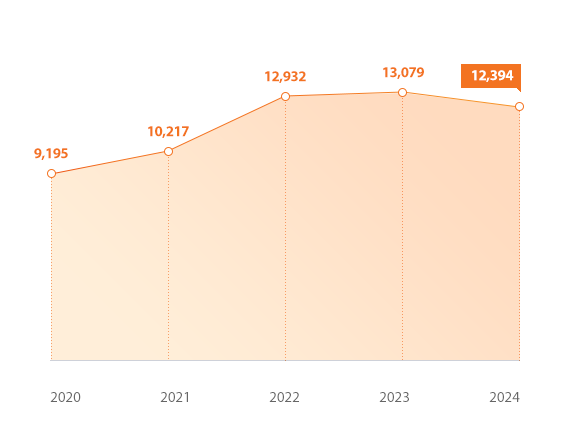
- 2020 : 9,195
- 2021 : 10,217
- 2022 : 12,932
- 2023 : 13,079
- 2024 : 12,394
Net Income Unit billion KRW
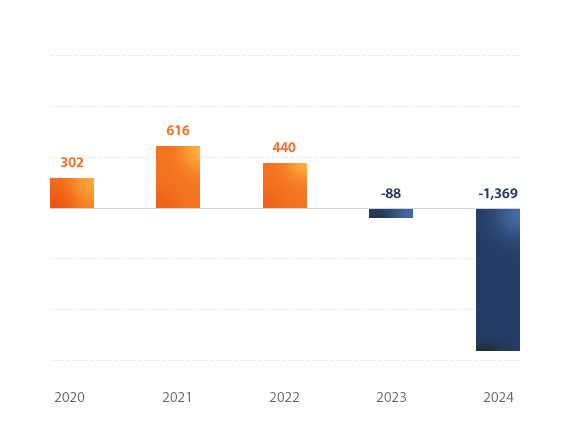
- 2020 : 302
- 2021 : 616
- 2021 : 440
- 2023 : -88
- 2024 : -1,369
Consolidated Income Statement
Unit billion KRW| 2021 | 2022 | 2023 | 2024 | 2025 | |
|---|---|---|---|---|---|
| Sales | 10,217 | 12,932 | 13,079 | 12,394 | 13,333 |
| Operating profit | 704 | 923 | 579 | -300 | -365 |
| Net Income | 616 | 440 | -882 | -1,369 | -615 |
| Profits attributable to owners of the parent |
619 | 433 | -141 | -1,404 | -650 |
Consolidated Balance Sheet
Unit billion KRW| 2021 | 2022 | 2023 | 2024 | 2025 | |
|---|---|---|---|---|---|
| Current assets | 6.074 | 9,783 | 9,797 | 10,883 | 12,637 |
| Non-current assets | 12,524 | 14,297 | 14,993 | 19,154 | 20,507 |
| Financial industry asset | 1,410 | ||||
| Total assets | 20,008 | 24,080 | 24,790 | 30,037 | 33,144 |
| Current liabilities | 5,788 | 8,177 | 8,734 | 11,708 | 12,736 |
| Non-current liabilities | 4,775 | 5,803 | 6,776 | 7,722 | 9,223 |
| Financial industry liabilities | 1,243 | ||||
| Total liabilities | 11,806 | 13,980 | 15,510 | 19,430 | 21,959 |
| Controlling interests | 8,159 | 9,124 | 8,117 | 9,450 | 9,101 |
| Non-controlling interests | 42 | 976 | 1,163 | 1,157 | 2,084 |
| Total equity | 8,201 | 10,100 | 9,280 | 10,607 | 11,185 |
※ During 2024, the method of presenting current and non-current in the consolidated balance sheet has been changed from the mixed method to the current/non-current classification method. Accordingly, financial assets and liabilities and non-financial assets and liabilities after 2022 have been combined.